Now Reading: Hardik Pandya vs Glenn Phillips: T20I Stats Face-off
-
01
Hardik Pandya vs Glenn Phillips: T20I Stats Face-off
In the thrilling world of T20 cricket, standout performances can often define a player’s legacy. Recently, all-rounders Hardik Pandya and Glenn Phillips have made headlines through their impressive skills on the field. This article dives deep into their T20I records after 84 matches, examining how their stats compare and what they contribute to their respective teams.
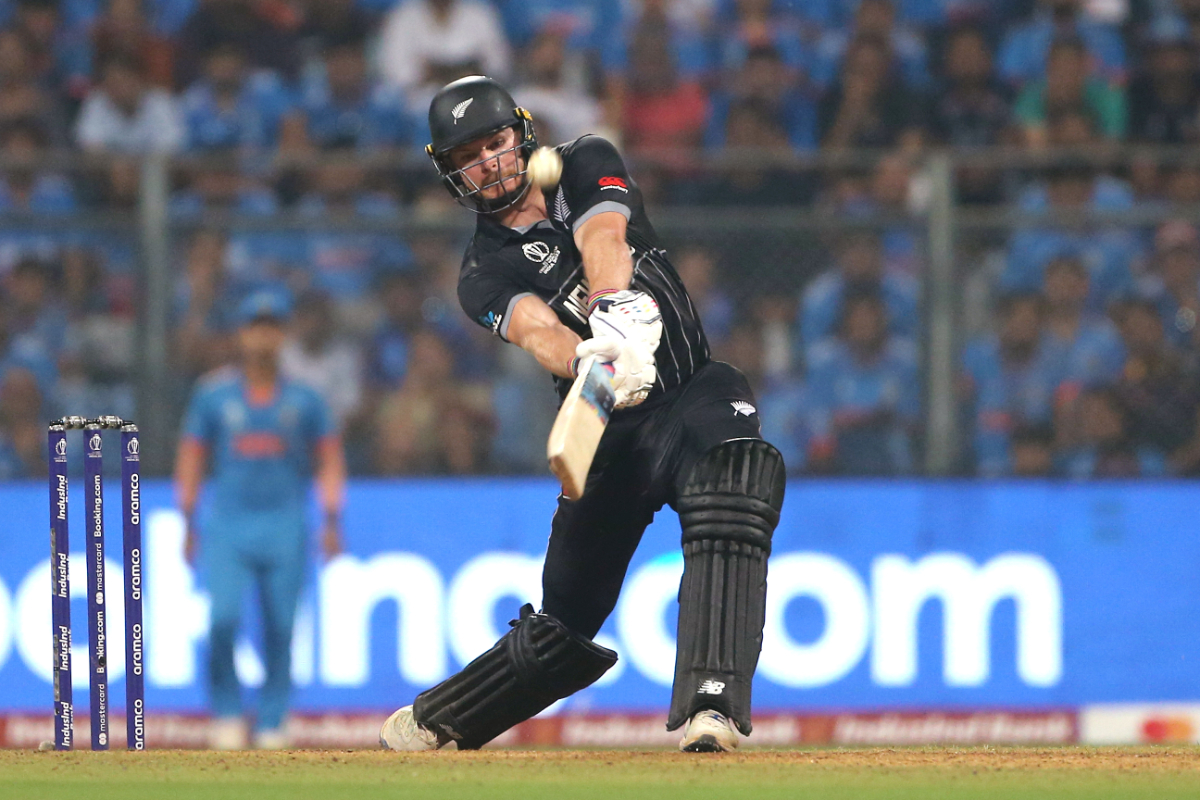
Glenn Phillips: A Rising Star
Glenn Phillips, the New Zealand all-rounder, has showcased his batting prowess in international cricket. Having made his debut against South Africa in 2017, the right-handed batter has established himself as a formidable player.
Key Statistics
| Stats | Glenn Phillips |
|---|---|
| Total Runs | 2007 |
| Batting Average | 31.85 |
| Strike Rate | 142.13 |
| Wickets | 6 |
| Best Score | 108 |
In his career, Phillips has smashed 1240 runs while winning 46 matches, with a standout batting average of 42.75 in those encounters.
Hardik Pandya: The Indian All-Rounder
Conversely, Hardik Pandya has been a crucial player for the Indian cricket team since his arrival on the scene in 2016. Known for his aggressive batting style and handy bowling, Pandya has made a significant impact.
Key Statistics
| Stats | Hardik Pandya |
|---|---|
| Total Runs | 1205 |
| Batting Average | 25.1 |
| Strike Rate | 143.96 |
| Wickets | 64 |
| Best Score | 71* |
Pandya has also enjoyed success, having won 57 out of his 84 matches while taking 56 wickets, establishing himself as one of India’s top all-rounders.
Statistical Comparison
Both players have impactful stats, highlighting their contributions:
| Player | Runs | Ave | SR | Wickets |
|---|---|---|---|---|
| Glenn Phillips | 2007 | 31.85 | 142.13 | 6 |
| Hardik Pandya | 1205 | 25.1 | 143.96 | 64 |
This numerical overview provides cricket enthusiasts insight into the efficacy and skill level of both players. While Phillips shines with his batting, Pandya edges out with his bowling capabilities.
Conclusion
As both players continue to evolve and improve, their stats offer a fascinating glimpse into their careers. Fans can expect thrilling performances from both Glenn Phillips and Hardik Pandya in the upcoming T20 matches.